Macroeconomists and policymakers talk about the “output gap,” which is the difference between where the economy is right now and it’s “potential level.” Unfortunately, this potential output is not directly observable, which means it must be estimated. There are several ways of doing this. Some approaches use theoretical models calibrated with information about the current state of the economy; others use statistical relationships between things like unemployment and inflation; finally, other methods simply look at a single variable (e.g. GDP or GNP) and attempt to filter out a trend from the noise.
Recently, there’s been some heated discussion about the third type of method. It concerns the use of a statistical tool called the “Hodrick-Prescott Filter,” named for its creators Robert Hodrick and Edward Prescott. The basic idea of the HP filter is to take time series data (for example GDP measured quarterly for a number of years) and split it into a longer-term trend and shorter-term fluctuations. In a sense, it’s similar to a moving average, which smooths out the jagged edges of a time-series.
To get a little more technical, the HP filter takes a time series $y_t$ and decomposes it into a trend component $\tau_t$ and a cyclical component $c_t$. The HP filter solves the minimization problem:
$\textrm{min} \sum^T_{t=1} (y_t - \tau_t)^2 + \lambda \sum^{T-1}_{t=2}[(\tau_{t+1} - \tau_t) - (\tau_t - \tau_{t-1})]^2$
The difference between the observed data and the trend is the cyclical component. The term $\lambda$ determines how smooth we want to make the trend. We'll come back to this point later.
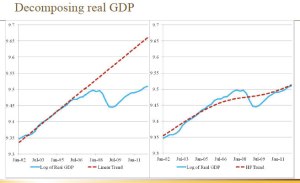
James Bullard, President of the Federal Reserve Bank of St. Louis, has used HP filtered GDP data to argue that the output gap is small, using the following chart (posted at Economist's View):
and arguing:
“The housing bubble and the ensuing financial crisis probably did some lasting damage to the economy, suggesting that the output gap in the U.S. is not as large as commonly believed and that the growth rate of potential output is modest. This helps explain why U.S. growth continues to be sluggish, why U.S. inflation has remained close to target instead of dropping precipitously and why U.S. unemployment has fallen over the last year—from a level of 9.1 percent in June 2011 to 8.2 percent in June 2012.”In contrast, Paul Krugman argues that the trend produced by the HP filter is not necessarily a good measure of economic potential:
“The use of the HP filter presumes that deviations from potential output are relatively short-term, and tend to be corrected fairly quickly. This is arguably true in normal times, although I would argue that the main reason for convergence back to potential output is that the Fed gets us there rather than some “natural” process. But what happens in the aftermath of a major financial shock? The Fed finds itself up against the zero lower bound; it is reluctant to pursue unconventional policies on a sufficient scale; fiscal policy also gets sidetracked. And so the economy remains below potential for a long time. Yet the methodology of using the HP filter basically assumes that such things don’t happen. Instead, any protracted slump gets interpreted as a decline in potential output!”Krugman’s point is an important one. Remember, the HP filter is a statistical tool for finding a trend in a univariate time-series. It cannot tell us what things would look like in the absence of the housing bubble or in light of different policies. Using the filter to ascertain the level of potential output requires theoretical assumptions like the ones Krugman identified above, which themselves must be established, not merely stated. As Steven Williamson explains:
“What is the economy's "underlying potential" anyway? It's the level of aggregate real GDP that we could achieve if, within the set of feasible economic policies, policymakers were to choose the policy that maximizes aggregate economic welfare. The HP trend is no more a measure of potential than is a linear trend fit to the data. The HP trend was arrived at through a purely statistical procedure... How then could the HP trend be a measure of potential GDP? To measure potential GDP requires a model. The model will define for us what "feasible economic policies" and "aggregate economic welfare" are. If we used Kydland and Prescott's procedure, above, we might construct a model, calibrate and simulate it, and argue that the model produces time series that fit the actual data. We might then feel confident that we have a good model, and use that model to measure potential output. Maybe the model we fit to the data is a Keyesian model, which implies an active role for monetary and fiscal policy. Maybe it's a model with a well-articulated banking and financial sector, with an explicit role for monetary policy.”However, Williamson takes issue with Krugman’s piece, arguing that he is misusing the HP filter:
“Look at the chart in Krugman's blog post.He's misusing the HP filter here in two ways (though of course what he wants to do is make people who use it look stupid)... he's using a value for [$\lambda$] that's just too small.”Here's where the $\lambda$ term comes in. The way the HP filter works is that you can set $\lambda$ really small and basically reproduce the curviness of the data; set $\lambda$ really high and fit a more or less straight line; or set it somewhere in between. The rule of thumb that Hodrick and Prescott established is setting $\lambda = 1,600$ for quarterly data and a larger value for higher frequency data.
Williamson is right that Krugman is using a relatively small value for $\lambda$, as the trend in his graph is rather curvy (though that wouldn't really affect the substance of his point). But what do we really know about $\lambda$? An interesting paper from outside the field of ecnonometrics (it was written by two statisticians, Robert L. Paige and A. Alexandre Trindade) suggests, maybe not that much.
Paige and Trindade show that the HP filter is really just a special case of a larger class of data-smoothing methods called "splines." While splines have similar parameters to $\lambda$, they are chosen optimally, rather than by rule of thumb. Specifically, spline-fitting algorithms select a value for $\lambda$ based on how well the smoothed function fits the data. The authors show that fitting an optimal value for $\lambda$ has a substantive impact on the resulting trend estimates, which may have important consequences for economic analysis. Ultimately, while the HP filter has a role to play in economic research and policymaking, consumers of research should maintain a health skepticism toward the tool.


No comments:
Post a Comment